Asynchronous messaging is the backbone of modern application architecture. The delivery and consumption of messages between components of a distributed architecture constitute one of the primary mechanisms for communication. Behind it all is the humble message broker, serving as the primary queuing source. Tie the application components and the message broker together with producers and consumers, and you have the basic structure required to facilitate asynchronous communication.
Unfortunately, distributed application design is never that simple. Opportunities for message loss and processing failure abound, which can lead to incomplete application flows and/or incorrect state. Faulty broker high availability configuration can lead to message loss in system crash scenarios. Application resiliency failure regarding message delivery and consumption can also lead to similar consequences.
A valuable goal for microservice-based applications is portability. Differing broker capabilities and API incongruities can lead to painful migrations when moving an application between different containing environments. Various performance, compliance, and pricing considerations often drive enterprises to consider different strategies, including on-premise and cloud. Using a common paradigm for application communication between possibly diverse message brokers (Kafka, cloud-native, etc.…) reduces the burden when responding to changing business requirements such as these.
There are other considerations as well. Flow control and back pressure are important when considering how your application is scaled for optimum throughput. Batching can also help alleviate network load, and compression can help with network and storage. While these considerations are important, I’ll instead focus primarily on the resilience and portability aspects mentioned above.
The Pillars
Durable and Atomic Delivery. Delivery of the message should eventually succeed, even in a broker outage. The durability should be tied to the committed data state driving the message.
Resilient Consumption. Consumers should retry failed messages when necessary - possibly over an extended time period.
Idempotent Processing. Processing should be sensitive to previous failures and attempts. Repetition of particular work units may lead to an incorrect state and should be avoided when it is susceptible.
Incomplete Processing Continuation. When possible, processing should be capable of resuming in the case of incomplete status (for example, a previous system crash during processing).
Immunity to Delivery Irregularities. When possible, application design should not depend on ordered delivery and only-once delivery.
Portable Design. Component interaction with the messaging broker should be through an abstraction layer.
Pillar 1: Durable and Atomic Delivery
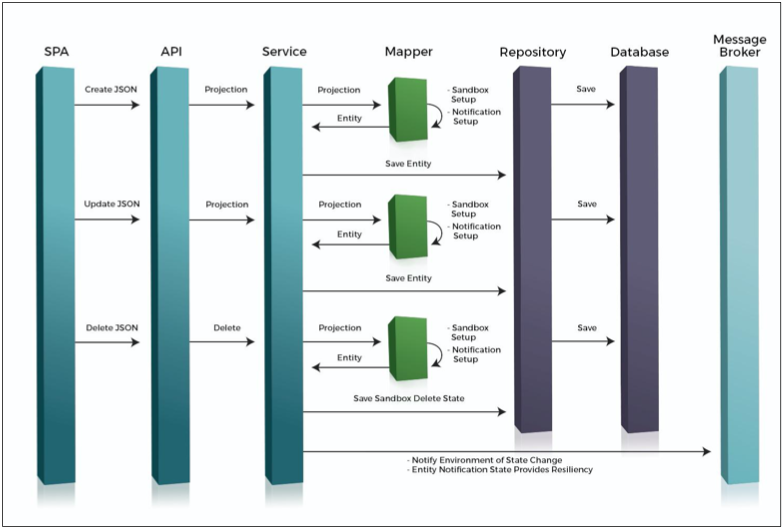
In the happy path flow, the message producer will connect to the message broker, send the message, and get an acknowledgment of delivery without a hiccup. However, in the case of a broker outage, the application may not be able to send the message immediately. In such a case, establishing a producer retry mechanism (usually with an exponential backoff) helps send the message when the broker eventually comes back online. Furthermore, tying the retry state to an associated entity change makes the durability atomic. For example, if an entity state persists, and then a message is immediately sent that is tied to this state change (common), it is correct not to send (or retry) the message if the transaction to commit the entity state fails. Successful entity persistence and message production are bound together. This is often achieved by persisting the retry state for the message to a database in the same transaction as the entity state change. Note that different producer retry threads per topic are also helpful in encouraging delivery fairness.
Pillar 2: Resilient Consumption
Message consumers will process messages successfully in most cases. However, if there is a system problem or data problem during processing, a message may fail processing with an exception. In such cases, the system should be capable of retrying the message (possibly with an extended backoff timeline). The following are some considerations regarding retry:
Exception type filtering
Not all cases call for a retry. For example, suppose the exception indicates that a problem with the data occurred. In that case, it can be inferred that the processing will never be successful under the current circumstances, in which case a retry is useless. However, the exception may instead indicate a temporary circumstance (e.g., network communication failure), in which case a retry is warranted.
Non-Blocking
Don’t block the main consumer flow for retries if you don’t have to. This doesn’t necessarily apply to all broker types, but Kafka (for example) is susceptible. Blocking retries in fairly quick succession may be ok, but extended retry backoffs in blocking flows can slow consumer throughput. Sometimes, this may be unavoidable if the design depends on ordered delivery. This can happen when a subsequent message on the same topic depends on an earlier message's outcome. However, as you recall above, we strive not to depend on ordered delivery, so blocking use cases should be unnecessary or minimized.
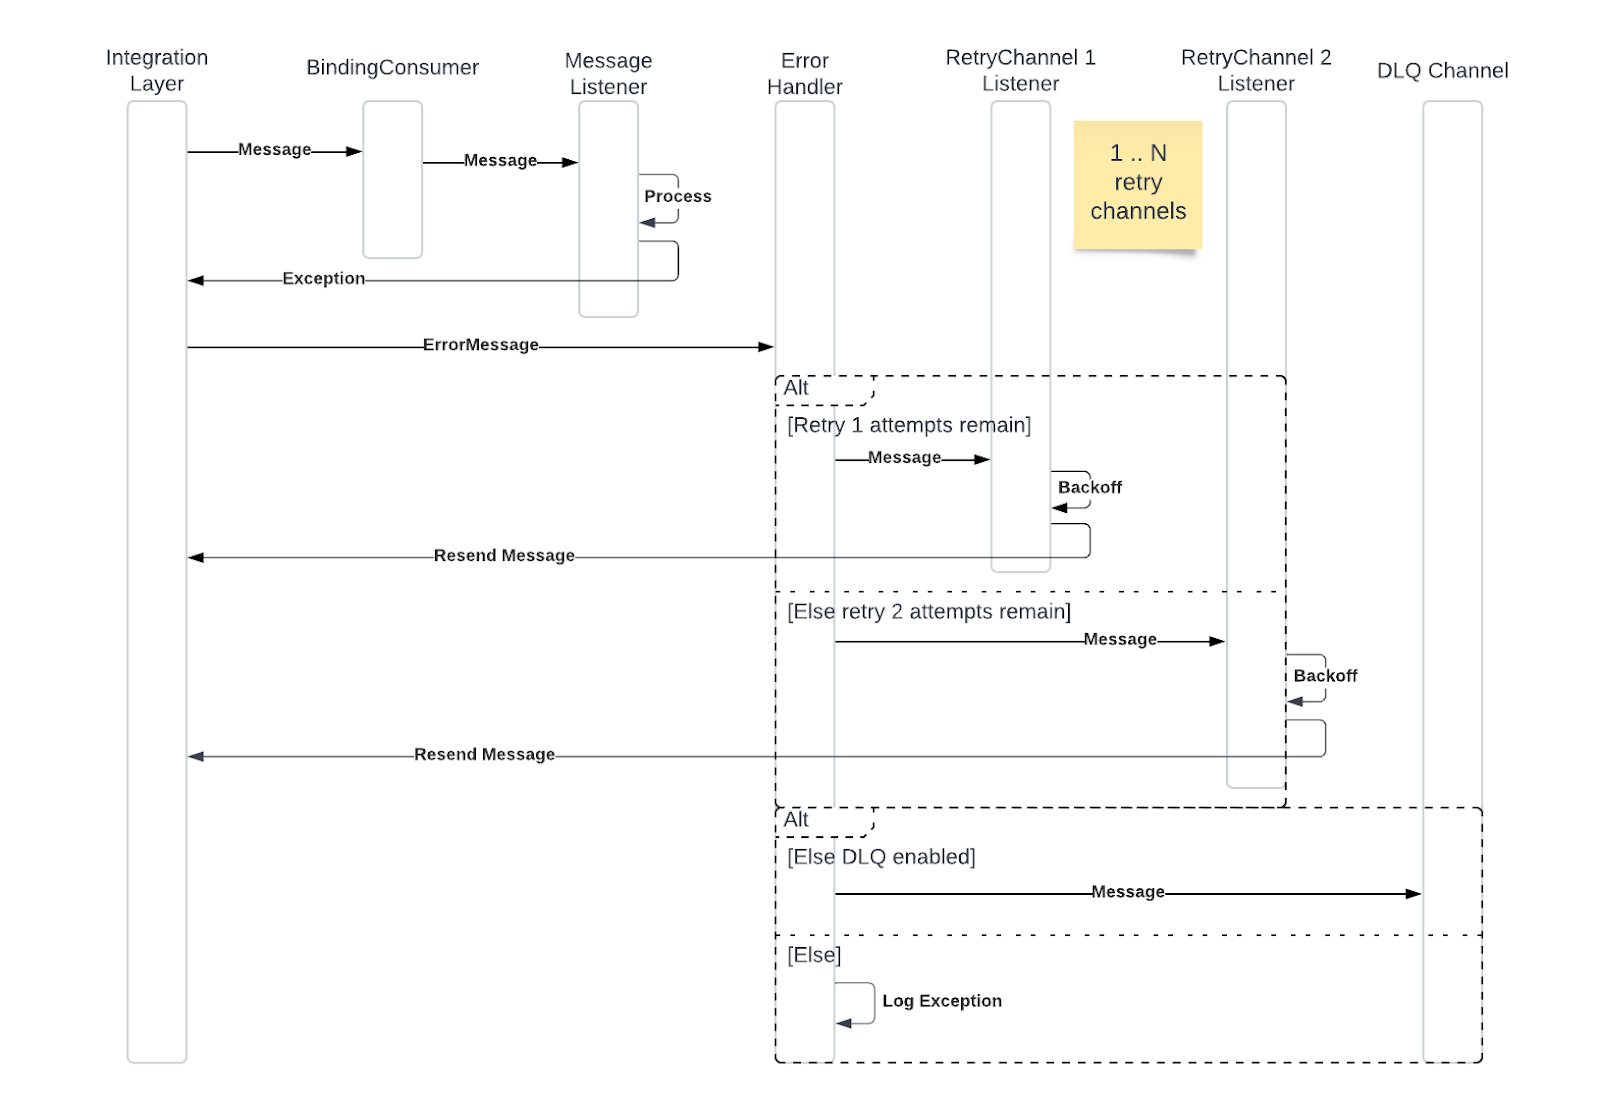
A common solution is to utilize multiple topics for normal consumption and retry. When a failure occurs, the message is qualified for retry and sent to a different topic, where it is parked for a fixed backoff period. Messages are occasionally checked for maturity and nacked until ready. When maturity is achieved, the message is re-sent for normal processing. Rinse and repeat until all retry phases are exhausted; at this point, the message may be sent to a Dead Letter Queue (DLQ) for further research and possibly subsequent handling.
Example Non-Blocking Flow
Pillar 3: Idempotent Processing
Retries (or duplicate delivery) can be problematic when the consuming process enacts the same set of steps multiple times. Sometimes, this is harmless if the repetition does not produce a harmful result. Cache invalidation and indexing processes are often examples of harmless repetition. In other cases, repetition is harmful - like charging a credit card twice. There are multiple ways to protect against this:
Smart Processing
If the consumer process is smart enough to understand previous completion status (especially in the case of multiple-step flows), it can self-regulate during repetition and only execute previously incomplete items and/or rectify the state.
Idempotency Key
The system may also add a special key to the message header that uniquely identifies the message. If the system maintains a datastore of used keys, it can faithfully check the store to see if it has seen the message before and not re-process the message if it is determined to be a duplicate. Note that this method has consequences for the retry approach mentioned above, so consideration must be given to key release under legitimate circumstances.
Pillar 4: Incomplete Processing Continuation
Not all failure scenarios are due to an exception encountered during active processing. In some cases, message processing simply “stops,” and the finished state is never fulfilled. Such a case can occur during a catastrophic system failure (e.g., the server crashes because of an out-of-memory problem). The system should retry delivery (possibly on another consuming component replica) in such a case. This case presents the same idempotency problems inherent to all retries. However, it adds the possibility of abandoning the process monitoring status, which may preclude the valid redelivery of the message in this case. As a result, the system should be able to detect the previous process was abandoned and allow the current delivery attempt to resume if the retry is gated by something like an idempotency key. Most commonly, this is achieved by interrogating the previous incomplete process status for a timestamp and comparing it to a stagnation threshold to determine if a takeover should occur.
Pillar 5: Immunity to Delivery Irregularities
Many situations in a distributed architecture can lead to duplicate message delivery and/or delivery of messages out of the original sending order. Some brokers strive to provide different guarantees in this area, but it is better not to rely on such guarantees. The system will be more resilient to unanticipated complications if the application components are bolstered with their own protection, including the measures related to idempotency mentioned above. Moreover, the application design will be more portable if not reliant on inconsistently supported features.
Pillar 6: Portable Design
If the consumer and producer components can be coded against an abstraction with underlying binding implementations for a variety of brokers, then the application can be moved more easily between containing environments. This includes moving between different clouds with different cloud-native broker implementations (e.g., Google PubSub, Amazon Kinesis, and Azure Eventhubs). This is most commonly achieved with an abstraction library. For example, the popular Spring Cloud Stream library is used to achieve this goal in the Java/Spring ecosystem.
Conclusion
With the correct amount of rigor, message-driven flows in microservice architectures can withstand a variety of complications and mishaps. I hope this discussion provides you with additional thoughts as you consider your own microservice design. I also invite you to review Broadleaf Commerce and the MAFEA architecture principles we employ to achieve a robust and resilient approach to the unique problems exposed by modern application architectures - including our solutions to the topics raised in this article.